Loading Ligand Networks Exported by Orion or FEP+#
OpenFE provides functions to load a ligand network from an OpenEye Orion NES .dat file or Schrödinger FEP+ .edge file.
This allows for creating a network of transformations using either of these external tools, then running the actual simulations with OpenFE.
Load the ligands#
Both FEP+ .edge and Orion .dat files identify molecules by name, so to load the network OpenFE requires a list of named ligands.
Load the ligands used by the network into instances of SmallMoleculeComponent. For more information, see Loading Small Molecules:
[1]:
%matplotlib inline
from rdkit import Chem
import openfe

supplier = Chem.SDMolSupplier("assets/somebenzenes.sdf", removeHs=False)
ligands = [openfe.SmallMoleculeComponent(mol) for mol in supplier]

ligands
[1]:
[SmallMoleculeComponent(name=benzene),
 SmallMoleculeComponent(name=toluene),
 SmallMoleculeComponent(name=phenol),
 SmallMoleculeComponent(name=benzonitrile),
 SmallMoleculeComponent(name=anisole),
 SmallMoleculeComponent(name=benzaldehyde),
 SmallMoleculeComponent(name=styrene)]
Select an atom mapper#
Both formats encode only the network itself, leaving mappings between atoms in each edge undefined. OpenFE needs an atom mapper to produce atom mappings; for more information, see Choose an Atom Mapper:
[2]:
mapper = openfe.setup.LomapAtomMapper(
    threed=True, # Use atom positions to prune symmetric mappings
    max3d=1.0, # Forbid mapping between atoms more than 1.0 Å apart
    element_change=False, # Forbid mappings that change an atoms element
)
Then, create the LigandNetwork from the edges in the network file:
Loading an FEP+ edges network#
Here we show how to take an FEP+ edge network file, assets/somebenzenes_fepp.edge and load it into an LigandNetwork object.
[3]:
from openfe.setup.ligand_network_planning import load_fepplus_network

fepp_network = load_fepplus_network(
    ligands=ligands,
    mapper=mapper,
    network_file="assets/somebenzenes_fepp.edge",
)
parallel map scoring
/Users/atravitz/micromamba/envs/openfe-notebooks/lib/python3.13/site-packages/gufe/components/explicitmoleculecomponent.py:74: UserWarning: RDKit does not preserve Mol properties when pickled by default, which may drop e.g. atom charges; consider setting `Chem.SetDefaultPickleProperties(Chem.PropertyPickleOptions.AllProps)`
  warnings.warn(
Loading an Orion NES network file#
Similarly we can take an Orion network edge file, data/benzenes.dat and load it into an LigandNetwork object.
[4]:
from openfe.setup.ligand_network_planning import load_orion_network

orion_network = load_orion_network(
    ligands=ligands,
    mapper=mapper,
    network_file="assets/somebenzenes_nes.dat",
)
parallel map scoring
/Users/atravitz/micromamba/envs/openfe-notebooks/lib/python3.13/site-packages/gufe/components/explicitmoleculecomponent.py:74: UserWarning: RDKit does not preserve Mol properties when pickled by default, which may drop e.g. atom charges; consider setting `Chem.SetDefaultPickleProperties(Chem.PropertyPickleOptions.AllProps)`
  warnings.warn(
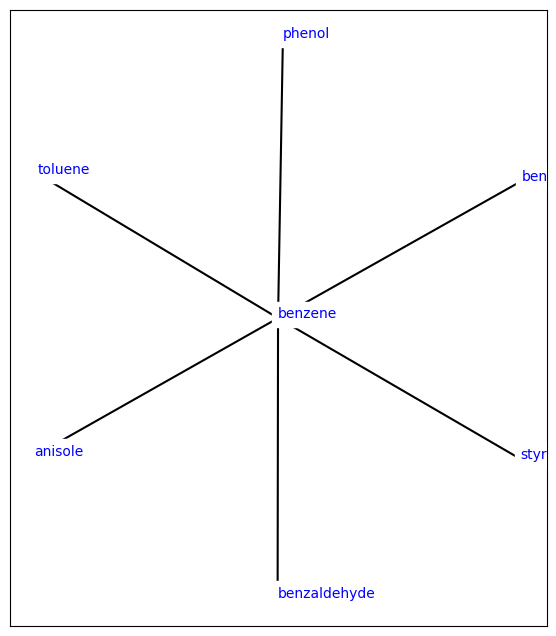
Visualizing the Network#
Once defined we can visualise the network as we normally would.
For more ways to visualize a LigandNetwork, see Visualizing Ligand Networks.
[5]:
from openfe.utils.atommapping_network_plotting import plot_atommapping_network

plot_atommapping_network(orion_network)
[5]:
[6]:
## Similarly we can visualize the individual mappings

from ipywidgets import interact, widgets

def display_edge(index):
    view = edges[index].view_3d(spheres=True, show_atomIDs=True)
    view.show()

# traverse through all views

edges = list(orion_network.edges)

interact(display_edge, index=widgets.IntSlider(min=0, max=len(edges)-1, step=1));
Creating an AlchemicalNetwork#
See Creating an Alchemical Network for how to use these defined ligand_network objects to create an AlchemicalNetwork, which can then be executed using the OpenFE CLI.